Vulcan Materials Company (VMC)
NYSE · Basic Materials
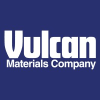
Vulcan Materials Company Cash on Hand 2007–2025
Vulcan Materials Company annual/quarterly cash on hand history from 2008 to 2025. Cash on hand refers to the total amount of cash and cash equivalents held by a company.
- Vulcan Materials Company cash on hand for the quarter ending December 31, 2025 were 183.3M, a 67.25% decrease year-over-year.
- Vulcan Materials Company cash on hand for 2025 were 183.3M, a 67.25% decrease from 2024.
- Vulcan Materials Company cash on hand for 2024 were 559.7M, a 39.89% decrease from 2023.
- Vulcan Materials Company cash on hand for 2023 were 931.1M, a 476.89% increase from 2022.
- Vulcan Materials Company cash on hand for 2022 were 161.4M.
Cash on Hand
QUARTERLY · $B
YOY QUARTERLY GROWTH · %
| Vulcan Materials Company Annual Cash on Hand (Millions of US $) | |
|---|---|
| 2025 | $183 |
| 2024 | $560 |
| 2023 | $931 |
| 2022 | $161 |
| 2021 | $235 |
| 2020 | $1,197 |
| 2019 | $272 |
| 2018 | $40 |
| 2017 | $142 |
| 2016 | $259 |
| 2015 | $284 |
| 2014 | $141 |
| 2013 | $194 |
| 2012 | $275 |
| 2011 | $156 |
| Vulcan Materials Company Quarterly Cash on Hand (Millions of US $) | |
|---|---|
| 2025-12-31 | $183 |
| 2024-12-31 | $560 |
| 2023-12-31 | $931 |
| 2022-12-31 | $161 |
| 2021-12-31 | $235 |
| 2020-12-31 | $1,197 |
| 2019-12-31 | $272 |
| 2018-12-31 | $40 |
| 2017-12-31 | $142 |
| 2016-12-31 | $259 |
| 2015-12-31 | $284 |
| 2014-12-31 | $141 |
| 2013-12-31 | $194 |
| 2012-12-31 | $275 |
| 2011-12-31 | $156 |
| 2010-12-31 | $48 |
| 2009-12-31 | $22 |
| 2008-12-31 | $10 |
Vulcan Materials Company Cash on Hand — FAQ
Vulcan Materials Company (VMC) cash on hand over the last 19 years — annual and quarterly figures with year-over-year growth and charts.
Where can I see VMC's cash on hand history?
The chart and table above show Vulcan Materials Company's cash on hand by year and by quarter, including the growth rate.